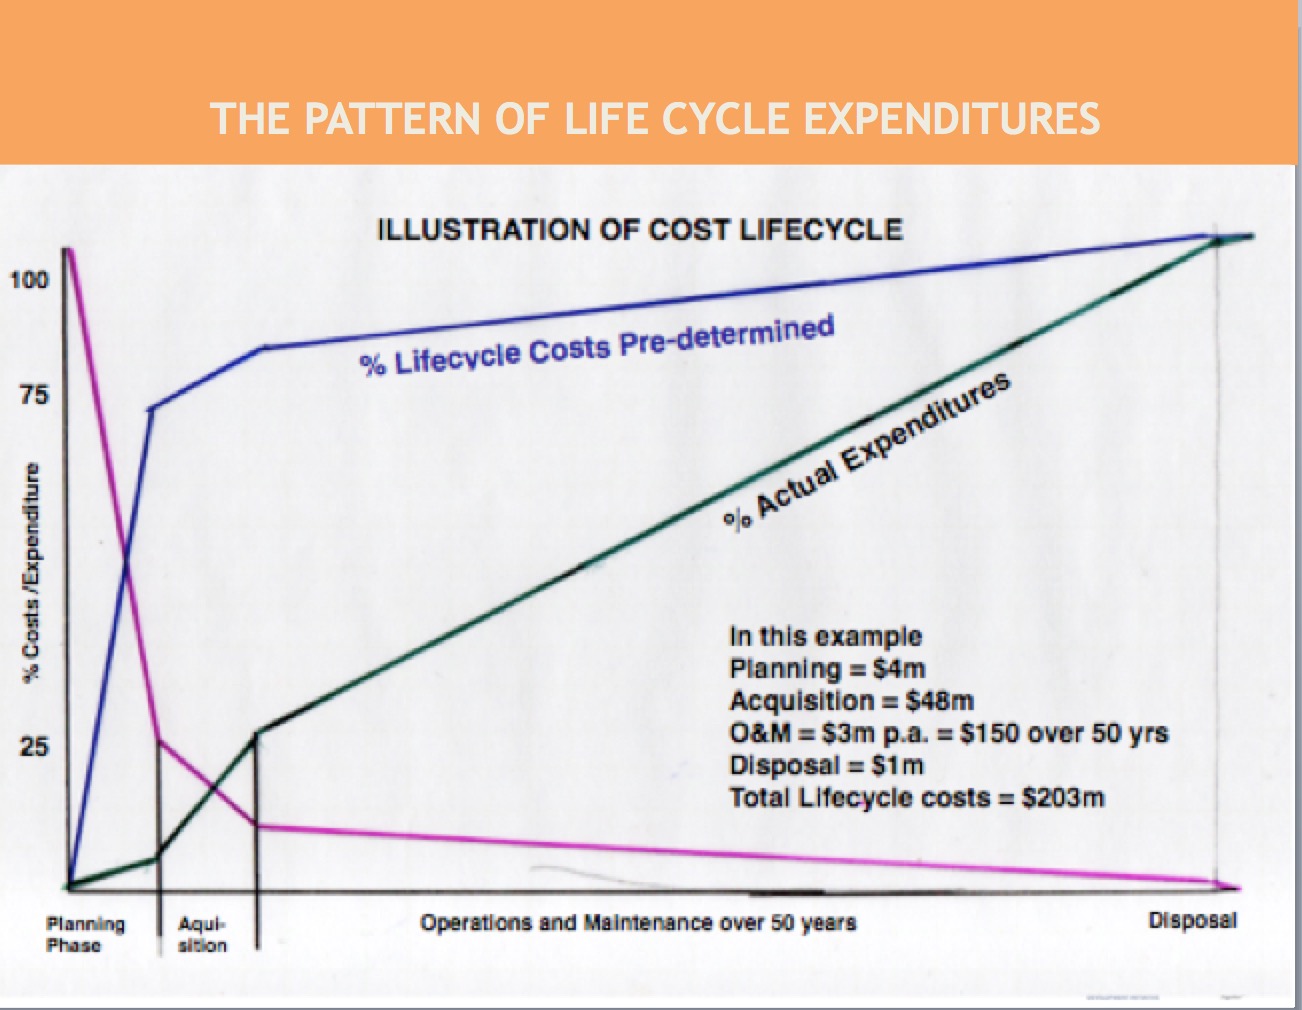
18 months ago I had the pleasure of co-designing and presenting a capacity building workshop for Auditors-General in the Pacific Islands. The subject of the workshop was auditing for the better management of public assets. We looked at the 4 stages – planning, construction,operations & maintenance and, finally, renewal or disposal – and discussion revealed that the auditors chose to spend the bulk of their time in analysing performance at the operations & maintenance stage. This made sense. It is by far and away the area where most expenses occur. However, it is not the stage where most expenses are committed. That occurs much earlier, at the planning stage. This is the stage where the nature, location and size of the project are determined and these are the primary determinants of how much will be spent later at the operations and maintenance stage.
I drew up a hypothetical schema to make the point. It showed that, by the end of the first or planning stage, only $4m of the total life cycle costs ($203m) had been spent BUT, the decisions made during this phase had already committed about 75% (and sometimes more) of the total costs. In the diagram the green line represents costs actually expended, the blue line costs pre-determined and the purple line represents the scope remaining to make a difference to total costs. This shows that by the time the plant is commissioned and operational, there is really relatively little that can then be done to improve on the overall life cycle costs.

The figures I used in this example are fictitious.
They are consistent with the theory and principles of life cycle costing as shown in the major textbooks on the subject.
I would have liked to use real figures but I couldn’t find any. So I contacted people who might be expected to know – key academic figures in asset management, experienced consultants, long time practitioners. But no, no-one could help.

Recent Comments