

Quantify the unquantifiable and you change the way that you are able to state goals, track performance, benchmark, evaluate, communicate, and measure outputs not just inputs.
Costs are easy to measure. they are quantitative. The aspects of performance that we are interested in, however, are nearly always qualitative. We want to know what effect our actions have had. Has this action of ours made things better or worse? Such qualitative measures are harder. This is why we are much more likely to default to measuring efficiency (a supply side cost issue) than effectiveness (a demand or user side performance issue). Consider some of the major measures that we use to track how we are going, as a country, or as an organisation – e.g. GDP, life cycle costing. Even benefit-cost analysis will traditionally focus on the measurable dollar amounts and fudge the unquantifiable externalities (both benefits and costs).
We can tie ourselves up in knots trying to express everything in dollar terms and to the extent that we succeed, we may be unaware of the elements inadvently omitted.
So today I want to introduce a technique that was introduced to me 20 years ago by Norman Eason, the Founder and First President of the UK Institute of Asset Management. He gave me this work to publish and I present it to you. If anybody would like to take up the challenge to develop it and take it further, now that technology has made tasks like this so much easier, maybe turn it into an App, I would be happy to put you in touch with the author.
Norman called his technique CAT – Comparative Assessment Technique. It enables you to determine whether qualitative outcomes are improving, whether goals have been reached. – and, if not, how far we are away from the desired end-state (and how much it will cost to get there!)
CAT is based on the simple, but operationally powerful, idea that any qualitative output can be expressed in terms of its worst state, its best, and all possible states in between.
Being able to measure qualitative outcomes/outputs makes it possible to
- Track developments over time
- Compare outcomes with other organisations
- Relate activities to outcomes
- Relate the cost of activities to the improvement in outcomes
So how is it done?
Suppose we use as an example of intangible factors the difficulty in measuring the Cleanliness of a Reception Area. We could list all the possible states, from worst state to best state, as follows: –
Ladder – Cleanliness of a Reception Area
- The filthy nature of the area is seriously affecting our relationships with staff/clients.
- We are always receiving complaints about how filthy the area is.
- We often receive complaints about how filthy the area is.
- We have had complaints about how filthy the area is.
- Although we have not yet received complaints from staff/clients about the dirty condition of the area, we know that this is likely to happen.
- We feel that as a company we are embarrassed by the dirty condition of the area.
- We feel that staff/clients believe that the area is very often dirty.
- We feel that staff/clients believe that the area is usually clean, but is often embarrassingly dirty.
- We believe that staff/clients think that the area is almost always clean.
- We believe that staff/clients think that the area is always clean.
- We never have any problems with the cleanliness of the area.
- We believe that staff/clients think that the cleanliness of the area is always excellent.
- We are always receiving favourable remarks from staff/clients about how clean the area is.
There is no limitation on the number of steps to be used
Note that we have not attempted to limit the number of steps to ten; this would have been the natural tendency, but it is pointless and an artificial irrelevance to the definition of the states. The CAT term for this list is a ladder and each listed state is a step on that ladder.
Setting Target Step
We can now designate the Target Step that the user and supplier agree should be met. Suppose this is Step 11. We never have any problems with the cleanliness of the area.
Setting Actual Step
The user and supplier can now select a step that matches the actual position at any one time. This is the Actual Step. Suppose this is selected to be Step 5. Although we have not yet received complaints from staff/clients about the dirty condition of the area, we know this is likely to happen.
Comparing the Two Steps
We can now obtain a measurement of the actual condition in relation to the target condition, thus Step 5/Step 11 = 0.45 so we are 45% of the way there.
Client-Contractor Relationships
Ladders such as this, especially if developed with joint input, have the potential for far better communication and understanding between client and contractor. It is possible for both to see clearly when a goal has not been achieved (with potential for service improvement) and when it has been over- achieved (with potential for cost savings)
Two interesting things become obvious from our earlier calculation.
- We now have a numerical value of something that previously could only be considered in subjective terms. (Target 45% achieved)
- We now have a decimal value of the relative position of the actual state against the target state, even though we did not start with a scale of ten.
Note:
- Any ladder can be of any length. In fact, the user and the supplier of the service determine the length by incorporating as many steps as are required to fully describe the activity.
- It doesn’t matter that the Target Step is not the top step of the ladder. Target Steps can be moved as new goals are agreed. Note also that there need not be equal increments between steps, although equal steps would be ideal.
- The technique is not restricted to Building Services. Ladders can be used to measure any activity in any one of a number of areas. These areas are not limited to commerce or industry; Local and Central Government are also relevant.
CAT can be applied to the measurement of anything that is intangible
What do you wish to measure?
In assigning CAT to an application area, it is helpful to consider what precisely is being measured. This may seem to be an obvious statement, but there is often confusion in this respect whether tangible or intangible measurements are required.
For example, do you wish to measure the performance of a group, or the results of their work? The two are not necessarily the same. CAT accommodates these more precise definitions of activities by providing for three types of ladder.
CAT can measure
- the performance of a task,
- the effectiveness (or result) of the task, and
- the consequence of the overall activity, e.g., what do the users think of the results?
These ladders can be used separately or combined into groups – any groups that the user organisation feels are important to measure or compare. Also, the activities associated with ladders can have parent/child hierarchies so that, for example, measurements can be rolled up from individuals to groups, to departments, to sites, to divisions and ultimately to the overall company or organisation. In both cases, users also need to agree the weights to be given to each ladder and activity.
Ladders can also be used for comparison in benchmarking exercises. For benchmarking, it is necessary for user organisations to agree on the standardisation of ladders.
If you would like to see the complete report, which contains examples of CAT ladders for consequences, performance, and effectiveness, email me at penny@TalkingInfrastructure.com
Do you know of similar work or perhaps other means of quantifying the unquantifiable?

The first vacuum cleaner was famously the size of a room, now we have the roomba! As we make things smaller we don’t only change the size – we change the properties and hence the possibilities. What does this mean for scaling down infrastructure?
Innovators and entrepreneurs focus on how to ‘scale up’ on the assumption the same benefits will occur but that there will be more of them. Yet when we ‘scale down’, at least if we do this in a major way, we don’t get the same benefits only fewer – we get very different benefits. Take Quantum Mechanics. When we move to an atomic scale the generally observed and accepted rules of physics and mechanics cease to apply. Or nanotechnology where again as we get smaller we get significant – and very useful – differences in material characteristics.
What about infrastructure?
In the past, as we have scaled up, we have reaped greater cost efficiencies, albeit with some greater risks, however most of the features we were interested in stayed the same or got better – cost, reliability. An example would be electricity. For many years, as larger size generators were developed, they provided reductions in both capital and operating costs. Then we networked, joining the production in many separate plants. We developed the national grid. At each stage of scaling up, gains were made.
Now, with the widening spread of digitisation, scaling down is becoming not only a viable option but the desirable option – even for infrastructure. And as we scale down we find that, just as with quantum mechnics, the accepted rules no longer apply, and just as with nanotechnology, new and interesting properties arise.
Again take electricity as an example.
As we move from large, centralised, fossil fuel generation, to small, local solar generation, the first thing that happens is that we change the user- supplier relationship. And with this we change the economic power relationship (no pun intended). Where we used to have one large centralised provider making all the decisions, now we have the possibility of many smaller prosumers in potentially separate networks. The leading electricity providers are recognising that the need for their services has changed – from provision of energy using their own large scale assets, to the management of energy in smaller localised grids and with the assets of others! This may include, as an intermediate stage, large solar farms feeding into a national grid.
This presents a challenge to the grid and its ability.
This challenge was at the root of the perceived (although not explicitly recognised) problem behind the recent Finkel Inquiry. It was not, as was commonly thought, an inquiry into the future of electrical energy, but rather into the future stability of the grid itself, a grid set up to manage supply from mass, centralised, power generation.
Instead of the traditional system of generation- transmission – distribution – use, with solar generation provided more locally, the need for the transmission function (moving electricity vast distances) falls away taking with it the need for substations
As we move from massive large scale to small scale infrastructure, (eg solar energy, or mobile telephony) the whole nature of the infrastructure changes and that gives rise to many new and very interesting possibilities.
It may be that as we ‘scale down’, we change the nature of the supplier-user relationship so much that what used to be a question of how we contained the cost of generation and distribution becomes something quite different – but what?
There is even the possibility that when we are able to develop cheap, effective storage, electricity may cease to be ‘infrastructure’ at all. It may, instead, become an individual resource, something we own like a car or washing machine. Within the next decade it could be that solar cells, (or perhaps solar roof paint) and battery storage are in common use.
Nor is scaling down unique to electricity.
Peter Diamandis tells of Dean Kamen’s “Slingshot,” a technology which can transform polluted water, salt water or even raw sewage into incredibly high-quality drinking water for less than one cent a liter. It uses an evaporative process, effectively boiling the water and then distilling the vapor. It does this in a device about the size of a bar fridge that can use any form of energy – even methane from dung. It is now being distributed across the underdeveloped world by Coca Cola as part of their aim to replenish 100% of the water they use in their drinks. Want to know more? Other technological developments are occurring for the treatment of sewerage.
The upshot of these new technological developments is going to be radical change in the very shape of infrastructure as we know it and an equally radical change in the economics and politics.
What does this mean for infrastructure decision making?
How do changes like this feed into our forward thinking for infrastructure? Or to ask the same question in a more provocative way – what is the future for our existing infrastructure? Do we renew and replace, or do we change?
If you find this an interesting thought, watch for our forthcoming podcast series where we translate the wider world challenges into what we need to think of with respect to infrastructure decision making.
[et_pb_section bb_built=”1″][et_pb_row][et_pb_column type=”4_4″][et_pb_text]
 Last week I suggested why asset management – at its early and basic level – is unstable. Getting your data reliable and customised so that you get credibility with your community is time consuming. But it pays! It not only protect your assets – it also protects your staff!
Let me tell you a story
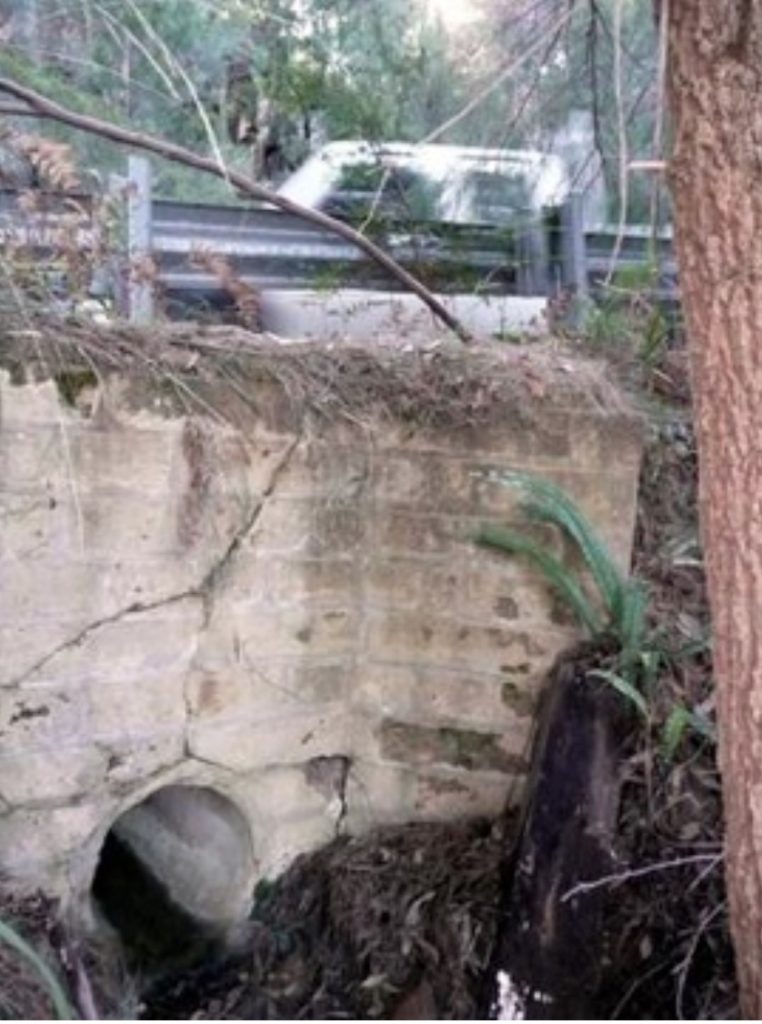
This is a true story about a certain council in New South Wales. In June 2007, during a wild storm, a section of the road collapsed causing a vehicle with 5 people to plunge into the flooded creek below. A mother, a father, their two children and another woman, a family friend all died.
The cause turned out to be an unlined culvert that had given way. In the subsequent coroner’s investigation it was revealed that:
• The council had been aware of the problem with the road as early as 2002 and had prepared an estimate to reconstruct the entire culvert but that details were never entered into the record management system.
• In 2004, pavement repairs triggered a request by the council’s asset manager to ask for quotes for concrete lining of the culvert with tenders called. But again, the information was not entered into the record system and no follow-up action was taken.
• Emails with quotes for roadwork that may have averted the collapse were not considered official records and were not recorded.
• A key finding of the review was ‘that at the time of the road collapse council’s inadequate reporting practices led to a failure to identify the critical need to upgrade some of its key road infrastructure’
Internet comment on the report of the accident was savage
“Too little too late. Good to see our rate money going towards incompetent council workers who hide behind their computers pretending to be busy. And when the accident did happen they actually had the nerve to try to pass the blame to the state /federal government. This accident should not have happened. For the lazy workers who didn’t do their job properly, how do you sleep at night?”
Is it a case of ‘lazy workers’ or did the system fail them? Unless your system is sound,how would you know? More especially how can they demonstrate their diligence to the outside world?
A poor asset management system puts your staff at risk!
The Central Coast’s ‘Express Advocate’ reported the mother of the young woman whose family perished as saying that she hoped the people who made the human error think about it every night. ‘We certainly do. They have destroyed our family’.
No member of your staff should have to live with this responsibility!
And, although reported as ‘human error’, if you look at the numbers of different people involved in this story, you have to ask yourself whether it is really ‘human error’ or actually ‘system error’.
Now the Coroner’s report was covered in both of the local papers. The reporting was noteworthy for two reasons: One: because both journalists actually used the term ‘asset management’ in their reports, and Two: because both reported that whilst asset was not good at the time of the accident, it was now ‘best practice’.
I was curious.
What had happened to improve asset management so much between the accident in June 2007 and the Coroners Report in March 2009? (less than 2 years) And what was it that impressed the journalists so much that they both reported that the council was now ‘best practice’ in asset management.
I decided to visit the council and find out. When I walked into the foyer, on the wall facing the entrance was their ‘mission statement’. It said simply “We aim to be a council that the community is proud of” and underneath it said “We are not there yet!”
That told me a lot about the current attitude of that council and their determination to get better.
Then I met with the Asset Manager and his Director of Information Services. Both were extremely open, articulate, knowledgeable – and very enthusiastic about asset management. They knew they had to improve their asset information and had taken serious steps in this direction.
But they also knew that improving asset information alone is not enough. They knew they also had to understand and improve their processes. And this is where they really shone. They analysed and streamlined each of their processes. There were dozens of these processes, each reproduced in large A3 size – and laminated, indicating that these were for constant use. They were bound in sections relating to different functions.
Mapping is a great way to understand your processes – and a great way to show others that you understand them! My guess is that it was these graphics that so impressed the journalists!
Taken together,
- greatly improved information +
- A positive, action-oriented, attitude – as expressed by the foyer plague and the confidence and knowledge of the Asset Manager and his Director of Information Services +
- Understanding of Asset Management Processes – as illustrated by the process maps,…
all added up to a situation where two different journalists from separate papers, in reporting the story of council failure, would both modify their criticism by making it clear to their readers that the council’s asset management was now ‘best practice’.
But there was an even better result.
After the coroner’s findings had been handed down with all the attendant publicity, the Sydney Morning Herald reported on yet another culvert in poor condition in the council area. In ordinary circumstances you would have expected the press to have a field day with this. But it didn’t happen.
Despite the obvious cracks and poor condition of the culvert, the Sydney Morning Herald’s journalist provided very balanced and moderate coverage. He quoted the consulting engineer’s findings, made some criticisms of the council but then tempered the report with the recognition that the cost to repair the problem was high relative to the annual budget; actually quoted figures, and comment by other councils about this problem and recognised that a large part of the problem was that the roads were handed over to councils by the State Government, who had previously had responsibility for them, with insufficient maintenance funds attached.
What price would you pay for fair media coverage?
Next week I look at why even good asset management is not enough. Why we have to ‘go beyond’.
[/et_pb_text][/et_pb_column][/et_pb_row][/et_pb_section]

I have long been interested in one particular aspect of the history of asset management. Why was it that agencies would so often progress to the stage of being the envy of all others in terms of their asset management – only to collapse and have to rediscover everything they previously knew? I suspected that there must be something inherently unstable about asset management – and there is! Here I explain what the problem is and how you can make sure it doesn’t happen to you.
You are going to come across a lot of definitions of asset management. Maybe you already have. All have validity. But the one that I favour at the moment has a focus not on what asset management does – but rather on what we get out of doing it!
I look at asset management as ‘a series of process and information improvements that enable organisations to see not only the likely consequences of the decisions taken today – but also of the actions not taken.’ You can argue with this definition, but bear with me, because you will see how it can help.
When armed with a knowledge of likely consequences you can make better decisions. You may not have enough money to do everything, but if you understand the consequences you can be reasonably confident that the things you are doing are at least of greater value to your organisation or community than the things you are not. Even more importantly, you can demonstrate this to others.
Asset management protects you. If you are a councillor, it protects you from pressure by lobbyists and those who would have you spend council resources in ways which you know are sub-optimal. If you are an administrator, it enables you weigh up different uses of your limited resources. If you are a manager responsible for assets, it enables you to know what to do that will best meet the service needs of the community.The key word is ‘consequences’.
When you can tell what is likely to happen next as a result of the actions you take today – and of your inactions – you are able to make better decisions and make them with confidence. And when you are able to demonstrate this to others and gain their confidence, life becomes much more enjoyable.
 Driving in the Dark
Without asset management, you are operating in the dark. It’s like driving at night with your headlights showing you just a few metres of the coming road. You are only able to see a little way ahead, and all of your decision making, whether on short or long term goals, is constrained by having such a limited view. So you have to move cautiously, never quite sure what those shadows mean, or what is coming next. And you can easily miss your turning and have to make time wasting course corrections. Or at worse, run into something with expensive, maybe fatal, results.
 Introducing asset management is now like switching on your high beam.
Suddenly, with a better view of the likely consequences of your actions, you can now see a long distance in front. You can move forward more confidently, make better decisions, and avoid potential problems, because you understand the likely consequences of actions and inaction.This is very exciting and it is not difficult to see why asset management creates evangelists. Many of you will have experienced this in the early stages of asset management, when, perhaps for the first time, you now have an overall view of your asset base, a better understanding of what you have, what condition it is in, and what its value is. This gives you a completely different view of what you can do – and it is pretty heady stuff.
But a word of caution!
What I have learnt is that when you reach this stage, you must not stop. The High Beam stage is unstable. When you are on the road, any approaching vehicle can force you to switch them off. Similarly when you are starting asset management, and you adopt generic assumptions about asset lives and desired service levels to get yourselves started, you get a ‘great leap forward’. This is the ‘switching on the high beams’ stage. It enables you to make progress quickly.
As in all things, easy come – easy go!
When things get tough – the asset management equivalent of the oncoming traffic – you can no longer rely on those generic assumptions and service levels. In times of trouble, such as missed grants, unexpected and unfunded asset renewals, in fact any difficulty, your staff and your ratepayers need to have full confidence in the reliability of your system and this means that you need to move on from the generic data and develop information that is credibly yours. In other words, you need to customise, to make the service levels and associated asset lives your own.
To do this you need to work with your community to develop service levels that are widely understood and accepted and can withstand criticisms.
Your asset data needs to reflect these service levels and to demonstrate the reliability that comes from documented, efficient, update mechanisms. Your asset lives need to reflect your own local conditions and known maintenance histories. And you need robust processes to ensure that all new asset acquisition reflects your strategic directions.
This takes effort, commitment – and time.
However, once you have done this, you are largely failure proof. By the time you have developed a good understanding throughout your staff from field staff to CEO, board or councillors, by the time you have good, up-to-date data, and by the time you have the confidence that this brings, then your asset management is secure.
You have successfully navigated the instability phase and come out safely on the other side. This stage of asset management is like adopting a Satellite Navigation System. Now you can analyse all the options and choosing the optimum course is easy.
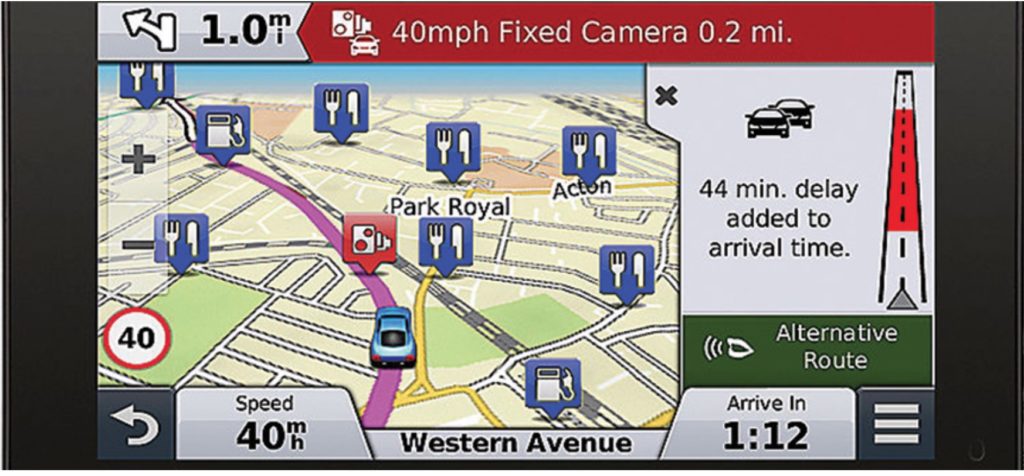
Moreover, when you get here you won’t want to stop. Now, asset management improvement for the benefit of your community will simply be the way you do business and you will enjoy always seeking to do better. The Road Ahead is now clearer and you travel it with confidence.
Questions?
- Where are you on the road to sound, reliable asset management?
- Are you still at the stage where you are using general purpose asset lives, gleaned from somewhere else? Or have you customised?
- Have you established accountable service levels? And are these service levels clearly and transparently connected to your asset life data? Do they inform your understanding of effective age and time to renewal?
- Have you reviewed, updated and streamlined your asset management practices?
Think this is too much work?
Then be sure to read next week’s post where we look at the danger not only for your assets, but for your staff ,of not getting to this stage of asset management.
Recent Comments